By Martelle Esposito and Joey Zeledon
Since 2009, WIC clients have received vouchers or electronic benefits on a card that they can redeem at a grocery store or other WIC-approved retail outlet for fruit and vegetables. In 2012, state redemption rates ranged from 17% to 98%, leaving approximately $100 million in unredeemed fruit and vegetables that year.
In a merging of public health and design minds to think about how to get more participants in WIC to redeem the full value of their fruit and vegetable vouchers/benefits, we created a journey map of the WIC client’s “journey:” from the WIC clinic to grocery store to dinner table.
A journey map is a design thinking tool traditionally used by the product and service design industry to identify opportunities to improve customer experience in order to achieve a desired outcome or behavior, which is often the purchase of a specific product or service. Informed by ethnographic interviews, observations, surveys, and empathy, a journey map outlines all the steps involved in using a product or service. It also visualizes customer processes, perceptions, needs, emotions, and relationships experienced during each step, providing a framework for considering how those experiences may influence a customer’s decision to perform the desired behavior.
We found a WIC client journey map to be useful in thinking about how to improve service delivery to achieve better redemption rates for fruit and vegetables. More generally, we found that journey maps can be directly integrated into existing public health methods for identifying barriers to behavior change and improving behavior change interventions. We determined that in the public health context, journey maps can:
Feedback from WIC program managers indicates that the WIC client journey map can be used as a tool to help WIC staff sympathize and empathize with the experiences of their clients. Doing so can improve customer service and help staff anticipate how different types of clients may need additional support and counseling to achieve their health goals.
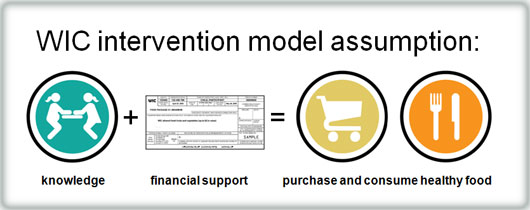
Public health professionals use behavior change models to show the relationship between the inputs, the activities, and the outcomes of a behavioral intervention. Essentially, they show the logical steps to achieving behavior change.
Because behavior change models are based on the assumption that the activities of the intervention will lead to the desired outcome(s), when the desired outcome is not achieved (i.e. redemption of WIC fruit and vegetable vouchers/benefits), a journey map can help identify gaps in the model by breaking down the steps of the intervention into more detailed experiences.
In our experience, we learned a lot can happen between receiving and redeeming the vouchers/benefits that could influence a family’s ability or willingness to redeem them. For example, WIC families may feel overwhelmed by selecting fruit and vegetables at the grocery store that add up to the exact value of their vouchers /benefits and give up. Or, they may feel embarrassed to ask for help because they do not want to be perceived as a WIC client. The journey map helped to dissect those interactions, processes, and emotions that are preventing the client from redeeming the full value of their vouchers/benefits.
Journey maps allow for easy comparison of programs at specific steps of the client journey. In the WIC context, each state and local WIC program operates a little differently under basic guidelines, and not all WIC programs have the same type of client. However, different programs may be facing similar challenges at certain steps, and other programs may have innovative solutions to those very problems.
The journey map offers a great framework for sharing best practices at each step, even if the programs as a whole are very different from each other.
By identifying micro-problems during the client journey, micro-solutions to these micro-problems can be borrowed from other public health programs found in peer reviewed literature or from unexpected places, including for profit businesses.
For example, a client may want to get enough fruit and vegetables to equal the amount of the full value of her vouchers/benefits without going over the total value. Ideally, the client should not need to worry about losing benefits.
We thought about an analogous experience of being frustrated about losing out on value and solutions to this problem. Among other things, this made us think about phone plans with roll-over minutes that phone companies once advertised heavily. We also thought about how unused SNAP (food stamp) dollars rollover into the next month.
Drawing inspiration from these analogous solutions, we identified a potential innovation in the WIC client journey. If the unspent value could roll over to the following month in the form of a new voucher or electronic benefits, over the course of the year the family will likely redeem more of the total value of their vouchers/benefits for the year.
Once gaps in the intervention model have been identified and innovations brainstormed, these new ideas need to be tested out to see if they are feasible solutions to the problems they are targeting.
Additionally, mapping out each step in the client journey may help inform research questions to ask in interviews, focus groups, and surveys, answers to which can also better inform the details of the journey map.
There is clearly value and opportunity in using journey maps to think about how to improve behavioral interventions. We encourage you to map out the client experiences of the population(s) you serve. Check out NWA’s webinar WIC Client Journey Maps: Your New Tool for Improving Service Delivery to learn details about how to do so.
Martelle Esposito is the Public Policy Nutritionist at the National WIC Association. Joey Zeledon is an Industrial Designer at Smart Design. These and other findings from the WIC client journey mapping project were presented at the 141st American Public Health Association Annual Meeting and Expo last week in Boston, MA.